
Chart Recorders
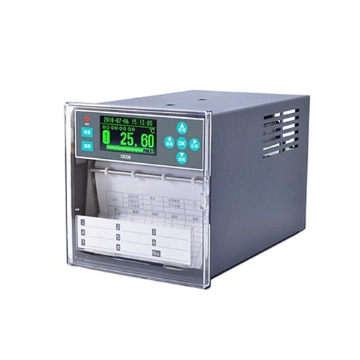
Digital Chart Recorder, 1-12 Channel

Paper Chart Recorder, 1-8 Channel
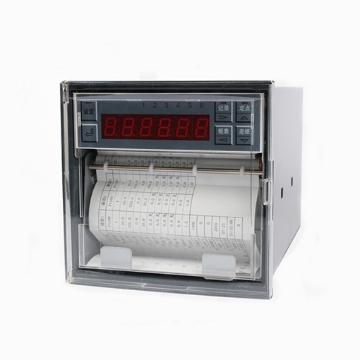
Temperature Chart Recorder, 1-8 Channel
Chart recorders are measurement instruments that record changes in process variables over time, helping users monitor operating conditions, review measurement trends, and maintain process records. Depending on the model, a chart recorder may use thermal printing or a pen-based mechanism to create records on paper while displaying measurement values on a digital screen.
SISCO offers paper chart recorders, digital chart recorders, and temperature chart recorders for industrial measurement and data recording applications. Available configurations include different input channel counts, recording speeds, signal input options, and display functions. These features allow users to select a chart recorder based on the variables being measured, the number of monitoring points, and the required recording method.
Key Features of Chart Recorders
Paper-Based Data Recording: Records measurement changes on chart paper for physical documentation, trend review, and record keeping.
Digital Measurement Display: Selected models feature digital displays for viewing measurement values while recording is in progress.
Multiple Input Channels: Depending on the model, multiple channels can accept compatible signals from sensors and measurement devices.
Adjustable Recording Speed: Selected models support adjustable paper feed speeds to accommodate different monitoring periods and recording requirements.
Flexible Signal Inputs: Depending on the configuration, supported inputs may include thermocouples, resistance temperature detectors (RTDs), voltage, and current signals.
Applications of Chart Recorders
Industrial chart recorders are used in manufacturing, laboratories, HVAC systems, environmental monitoring, and process control. They help document temperature changes, monitor pressure-related signals, and track other compatible process variables over time. Recorded charts can support quality checks, process reviews, equipment monitoring, and historical data analysis.
How to Choose a SISCO Chart Recorder?
Choosing the right SISCO chart recorder depends on your measurement requirements, recording method, and application environment. Before purchasing, consider the following factors to find a suitable model for industrial monitoring and data recording.
- Recording Method: Choose a paper chart recorder if you need a physical record of measurement trends. For electronic data storage and screen-based monitoring, consider a paperless recorder.
- Input Channels: Select the number of channels according to how many measurement points you need to monitor simultaneously. Multi-channel chart recorders can help track multiple process variables with one instrument.
- Measurement Type: Check compatibility with the signals you need to measure, such as temperature, voltage, or current. For temperature recording, verify the supported thermocouple or RTD inputs.
- Recording Speed: Consider the required chart speed and recording interval based on how quickly the measured values change and how much historical detail you need.
- Additional Functions: Review available alarm outputs, display options, communication interfaces, and power supply specifications to ensure compatibility with your monitoring system.
Compare the specifications of available SISCO chart recorders to identify a model that meets your measurement, recording, and installation requirements.
| Chart Recorder Type | Channels | Recording Method | Typical Applications |
| Digital Chart Recorder | 1–12 | Digital display and thermal printing | Industrial process monitoring |
| Paper Chart Recorder | 1–8 | Paper-based thermal recording | Continuous measurement recording |
| Temperature Chart Recorder | 1–8 | Temperature recording and printing | Temperature monitoring and laboratory use |
Chart Recorder FAQs
1. What is a chart recorder?
A chart recorder is an instrument that records changes in measured variables over time, typically by printing data or drawing measurement trends on paper. Depending on the model, it may also include a digital display for real-time readings.
2. What is the difference between a paper chart recorder and a paperless recorder?
A paper chart recorder creates physical records on chart paper using a printing or pen-based mechanism. A paperless recorder stores measurement data electronically and displays readings or trends digitally without requiring paper for routine recording.
3. What can a chart recorder measure?
Depending on its input configuration, a chart recorder can record temperature, voltage, current, and other compatible measurement signals. Some industrial models accept thermocouples, resistance temperature detectors (RTDs), or other sensor inputs. Always check the specifications of the selected model.
4. What should I consider when buying a chart recorder?
Consider the measurement range, input signal types, number of channels, recording speed, display features, power supply, and installation dimensions. The appropriate model depends on the process variables being monitored and the recording requirements.
5. Where are chart recorders used?
Chart recorders are used in industrial manufacturing, laboratories, HVAC systems, environmental monitoring, and process control. They provide a visual history of measurement changes that can help with process evaluation and record keeping.

Shop on sisco.com for all of your industrial test and measurement equipment & accessories including portable detectors, meters, testers, scales, etc.


