In the field of optical analysis, spectrometers and photometers are two extremely important types of modern analytical instruments. Using light as a medium, they achieve material analysis and are widely used in chemistry, biology, materials science, environmental science, medicine, and industry. However, their core functions, technical principles, and application scenarios differ significantly. A thorough understanding of their differences and connections is crucial for accurately selecting analytical tools.
I. Essential Differences from the Perspective of Analytical Objectives
Spectrometers: The "All-Round Analyst" that "Draws Spectra"
A spectrometer is a precision instrument capable of decomposing incident light into components of different wavelengths and measuring the intensity of each wavelength. Through spectroscopic elements (usually composed of slits, gratings, or prisms, detectors, etc.), light is dispersed according to wavelength or frequency, obtaining the energy distribution of absorption, emission, or scattering of substances at different wavelengths, thus enabling qualitative and quantitative analysis of substances.
The core objective is to decompose composite light into monochromatic light and measure the intensity distribution of each wavelength, ultimately outputting a "wavelength-intensity" relationship curve, i.e., a "spectral graph." This type of spectrum acts like an "optical ID card" for matter, containing information about its optical properties across the entire wavelength range. It not only reflects the absorption, reflection, or emission of light at different wavelengths but also reveals the composition and structure of the substance through characteristic peaks.
Photometer: The "Specialized Measuring Tool" for Precise Intensity Measurement
A photometer typically uses filters to select a specific wavelength range and then measures the changes in light intensity within that band using a photoelectric sensor. It primarily measures light intensity, such as luminous flux and illuminance. A photometer doesn't necessarily need to perform spectral analysis; if it has a spectral system, it's called a "spectrophotometer," which typically measures the absorption, transmission, or emission intensity of light at a specific wavelength or band.
The core objective is to measure the intensity change of light at a specific wavelength after it passes through a sample. It doesn't require analyzing the distribution of light across the entire wavelength range; it only needs to select one or a few specific wavelengths of monochromatic light (such as the specific ultraviolet wavelengths commonly used for detecting heavy metals in water), illuminate the sample, and then measure the intensity change of the transmitted or reflected light. This change is then combined with the Lambert-Beer Law (absorbance is proportional to the concentration of the substance) to calculate the concentration, and the substance's properties are inferred from the attenuation of light intensity.
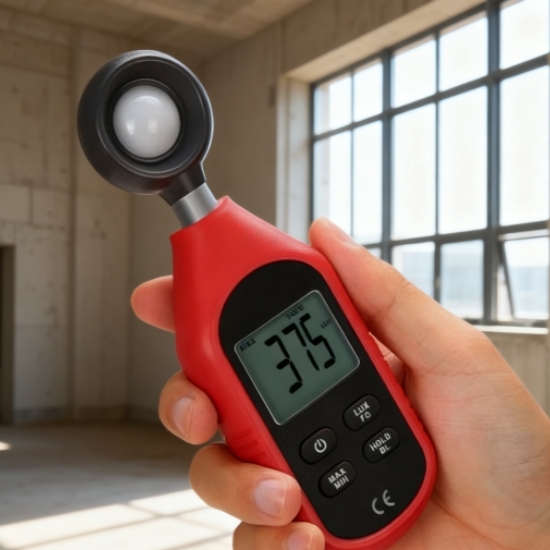
It's worth noting that the Lux photometers are precision instruments within the photometer family specifically designed to measure light intensity. Its core function is to quantify the visible light energy received per unit area, typically measured in lux. As an important branch of photometers, it converts light signals into electrical signals through built-in photoelectric sensors (such as silicon photodiodes or photodiodes), which are then processed and calibrated to directly display the illuminance value of the measured surface. The Lux light meter photometer focuses more on the "light reception effect," eliminating the need for complex integrating spheres or other auxiliary devices, making it convenient and portable. They are widely used in everyday life and professional scenarios, such as lighting compliance testing in public places like offices, classrooms, and hospitals; lighting calibration for photography and videography; and adjusting lighting comfort in homes and workshops. They not only meet the needs of ordinary users for intuitive assessment of ambient light but also provide accurate data support for lighting project acceptance and optical scene optimization. The digital Lux light meter is a highly practical and frequently used sub-type of photometer.
In short, the core of a spectrometer is "producing spectra and analyzing the overall picture," while the core of a photometer is "producing numerical values and measuring quantities." Whether you're looking for a spectrometer that provides "full-band spectral analysis" or a photometer that focuses on "quantitative detection at specific wavelengths," choosing the right instrument is fundamental to accurate experiments and efficient analysis. To find professional equipment that matches your diverse testing needs, consider checking out the SISCO online store—it offers a comprehensive selection of rigorously vetted testing instruments, from basic diagnostics to sophisticated analysis equipment, providing the perfect tool for your experiments or work.
II. Functional Differences from a Technological Perspective
The Core Technology of a Spectrometer: Dispersive Element
The "heart" of a spectrometer is a grating (or prism). The grating has numerous precise, equally spaced lines. Utilizing the principle of light diffraction, light of different wavelengths exits at different angles, thus achieving spatial dispersion. Combined with a slit and array detector (such as CCD/CMOS), it can simultaneously capture light signals across the entire wavelength range. This allows modern spectrometers to complete a full-spectrum scan instantly, possessing high speed and high resolution (able to distinguish two peaks with extremely close wavelengths).
The Core Technology of a Photometer: Filter
The "heart" of a photometer is a filter. It is an optical element that allows only light within a specific wavelength range (passband, usually wide, such as 20-40nm) to pass through, while strongly absorbing or reflecting other wavelengths. This is like a strict goalkeeper, only allowing light with "tickets of a specific color" to pass through. A detector (such as a phototube or photodiode) then measures the intensity of this "quasi-monochromatic light." This structure is simple, robust, and inexpensive, but sacrifices flexibility in wavelength selection and resolution. A Special Feature: Spectrophotometers
It's worth noting that a hybrid instrument exists on the market—the spectrophotometer. Although its name includes "photometer," its core uses a monochromator (usually also containing a grating) similar to that of a spectrometer to produce monochromatic light. Users can continuously adjust the desired wavelength. Therefore, spectrophotometers functionally fall between the two: they can perform precise quantitative analysis like photometers, and also perform simple wavelength scans, but their scanning speed and full-spectrum performance are generally inferior to dedicated spectrometers.
III. Applicable Fields from the Perspective of Practical Needs
The differences in their working principles and functions determine that spectrometers and photometers each have their own strengths in practical applications, and each is suitable for different demand scenarios.
Spectrometers: Focusing on "Exploring the Unknown" and "Multi-Component Analysis"
The "spectral discrimination" capability of spectrometers makes them indispensable in scenarios requiring the identification of material composition, the analysis of structure, or the simultaneous analysis of multiple components:
Materials Science: Ultraviolet-Visible-Near-Infrared spectrometers cover the wavelength range of 190-2500 nm, and can analyze the band gap, thin film thickness, and optical constants of semiconductor materials. They are core equipment for photovoltaic materials research.
Environmental Monitoring: Atomic Emission Spectrometry (AES) can simultaneously determine multiple heavy metal elements such as lead, mercury, and cadmium in water bodies, achieving rapid screening through the characteristic emission lines of different elements. Infrared spectrometers can qualitatively analyze the types of organic pollutants in soil.
Jewelry and Criminal Investigation: In jewelry identification, spectrometers can distinguish between natural and synthetic diamonds by analyzing the absorption spectra of gemstones; in criminal investigation, fluorescence spectrometers are used to detect trace amounts of drugs, with picomolar sensitivity far exceeding conventional detection methods.
Drug Development: Infrared spectrometers are used for structural confirmation of drug raw materials, verifying molecular structures by comparing them with standard spectra; fluorescence spectrometers are used to explore the interaction mechanisms between drug molecules and biological macromolecules.
Photometers: Emphasizing "Rapid Quantification" and "Routine Detection"
The "high-efficiency photometric" characteristics of photometers make them the preferred tool for quantitative analysis of batch samples and routine quality control:
Clinical Testing: Hospital laboratories use UV-Vis spectrophotometers to measure biochemical indicators such as glucose and cholesterol in blood. The operation is simple and the results are rapid, meeting the high-throughput testing needs of clinical samples.
Food Industry: Photometers measure the absorbance of pigments in food to control the amount added or to detect whether the content of preservatives meets safety standards; this is a common method for end-of-line quality control.
Water quality analysis: Basic photometers can quickly determine turbidity and residual chlorine content in water, directly outputting concentration values through light intensity attenuation at specific wavelengths, without the need for complex spectral analysis.
Lighting engineering: As a branch of photometers, illuminance meters are used to measure ambient light intensity, ensuring that lighting in classrooms, offices, and other places meets national standards. Their core function focuses solely on the total intensity of visible light.
IV. Selection Guide: A Needs-Based Tool Decision Framework
Choosing between a spectrometer and a photometer essentially boils down to prioritizing your analytical needs. The following four core dimensions can serve as the basis for your selection:
Analytical Purpose: Qualitative vs. Quantitative Priority
If you need to answer questions like "What is this substance?" or "What is its structure?", a spectrometer is essential. For example, analyzing ore composition in geological exploration or identifying unknown drugs in criminal investigations requires qualitative judgment based on characteristic peaks in the spectrum. If you only need to answer questions like "What is the concentration of the substance?" or "Is the light transmittance good?", a photometer is sufficient, such as for measuring serum bilirubin concentration in clinical settings or detecting thin film transmittance in industrial applications.
Sample Characteristics: Single-Component vs. Multi-Component
For single-component samples, a photometer is the preferred choice due to its speed and efficiency, such as determining the vitamin C content in beverages. If the sample contains multiple analytes, the multi-wavelength analysis capability of a spectrometer is more advantageous—an atomic emission spectrometer can simultaneously measure dozens of metal elements in a sample without multiple measurements, while a photometer requires changing different filters for step-by-step detection, affecting both efficiency and accuracy.
Detection Sensitivity: Routine Detection or Trace Analysis
In trace substance detection scenarios, spectrometers offer a significant advantage in sensitivity. Fluorescence spectrometers can detect fluorescent compounds at the picometer level, while atomic absorption spectrometers have detection limits for heavy metals down to the ppb level (parts per billion), making them suitable for detecting trace pollutants in the environment. Photometers typically have sensitivities in the milligram to microgram range, making them more suitable for analyzing samples with typical concentrations.
Cost Budget: Basic Needs or Professional Research
Photometers have a relatively simple structure and typically cost several thousand to tens of thousands of yuan, with low maintenance costs, making them suitable for basic testing needs in routine laboratories. Spectrometers, due to their more sophisticated dispersive and detection systems, range in price from hundreds of thousands to millions of yuan. Inductively Coupled Plasma Atomic Emission Spectrometry (ICP-AES), for example, is a high-end analytical device primarily used for professional research in research institutions and large enterprises.
In recent years, with advancements in optoelectronic technology and computational algorithms, the boundaries between these two types of instruments are becoming increasingly blurred. The emergence of portable spectrometers has enabled the miniaturization and modularization of previously expensive and bulky equipment, allowing connection to computers or mobile phones via USB interfaces for real-time display of spectral data. Portable photometers, combining microprocessors and digital filtering technology, enable multi-band measurements and automatic calibration, significantly improving measurement accuracy and repeatability.
Although spectrometers and photometers both belong to optical laboratory instruments and application positioning, they reflect a "research-oriented" versus an "engineering-oriented" approach. Spectrometers provide comprehensive analysis of light, revealing the interaction mechanisms between light and matter; photometers, on the other hand, provide rapid, quantitative measurement results, serving as highly efficient tools in production testing. With the development of intelligent and miniaturized technologies, the two are gradually merging, jointly driving optical measurement towards greater precision, portability, and intelligence.