
A chart recorder is a measuring instrument that records changes in variables such as temperature, pressure, voltage, and current over time. By creating a continuous or periodic record of measurement data, it helps users monitor operating conditions, identify trends, and review process performance. Chart recorders are widely used in manufacturing, laboratories, environmental monitoring, equipment testing, and other applications that require reliable measurement records.
Choosing the right chart recorder requires more than checking the price or display format. Input signal compatibility, channel count, recording method, measurement accuracy, chart speed, and installation conditions all affect instrument suitability.
This guide explains how chart recorders work, compares common recorder types, outlines important specifications, and provides practical tips for selecting a model that meets your measurement requirements.
What Is a Chart Recorder?
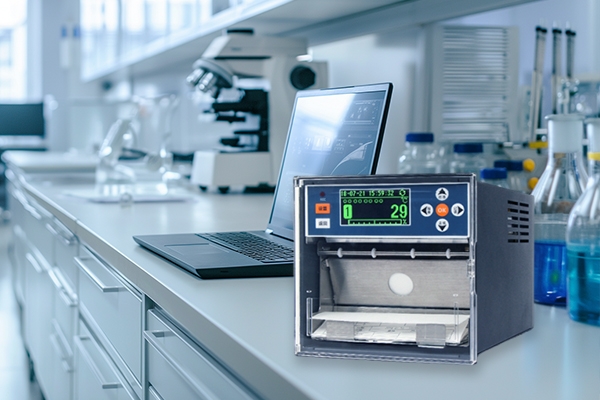
A chart recorder is an instrument that measures and records changes in physical or electrical variables over time. Traditional models use a pen or thermal printing mechanism to mark measurement values on chart paper, creating a visual record of how a measured variable changes.
Depending on the model, a chart recorder may support temperature sensors, voltage inputs, current signals, or other compatible measurement inputs. Multi-channel instruments can record several measurement signals, allowing users to observe different variables or measurement points within the same system.
The main purpose of a chart recorder is to preserve measurement history rather than display only the current reading. Recorded trends can help users investigate abnormal fluctuations, compare operating conditions, document test results, and evaluate process stability.
Types of Chart Recorders
Chart recorders differ in their recording mechanisms, input configurations, and data management capabilities. Understanding these differences helps narrow the selection according to the intended application.
Digital and Hybrid Chart Recorders
Some chart recorders combine electronic measurement processing and a digital display with paper-based recording. These instruments can make it easier to read measurement values while retaining a physical record of trends.
However, a digital display does not necessarily mean that a recorder supports electronic data storage or network communication. Those capabilities must be confirmed in the individual product specifications.
A hybrid recording solution may be appropriate when operators need convenient digital readings alongside printed measurement records.
Paper Chart Recorders
A paper chart recorder records measurement changes on chart paper using a pen mechanism or thermal printing system, depending on the model. It provides a physical record of measured values over time, allowing users to review trends, document operating conditions, and retain measurement records for later reference.
When selecting a paper chart recorder, consider the number of input channels, supported signal types, available chart speeds, measurement accuracy, and paper replacement requirements.
Key Features to Consider When Choosing a Chart Recorder
The best chart recorder is one that matches the required measurements, recording format, and operating conditions. Evaluate the following specifications before making a decision.
Input Channels
Input channels determine how many measurement signals a recorder can monitor. A single-channel instrument may be sufficient for one measurement point, while a multi-channel model can record several signals using one device.
For example, a temperature test may require measurements from several locations, while a process monitoring system may need to track temperature and electrical signals simultaneously.
Before selecting the channel count, consider the number of sensors, whether measurements must be recorded at the same time, and whether future expansion is likely. Also verify which input types are supported by each channel.
Input Signal Compatibility
Input compatibility is essential because a recorder must be able to process the signal produced by the connected sensor or transmitter.
Depending on the model, supported inputs may include:
- Thermocouples for temperature measurement
- Resistance temperature detectors (RTDs), such as Pt100 sensors
- DC voltage signals
- Current signals, including 4–20 mA signals
- Other specified sensor or transmitter outputs
Not every chart recorder supports all these inputs. Check the permitted signal ranges, sensor types, channel configuration, and any additional signal-conditioning requirements before connecting equipment.
Measurement Accuracy and Resolution
Measurement accuracy indicates how closely the measured value corresponds to the actual value under specified conditions. Resolution describes the smallest change that the instrument can distinguish or display.
These are different characteristics. A recorder with a high-resolution display or detailed chart trace does not automatically provide higher measurement accuracy.
For applications that require precise measurements, compare the specified accuracy, measurement range, input characteristics, and calibration requirements. Consider the complete measurement chain, including the sensor, transmitter, wiring, and recorder, because each component can affect the final result.
Chart Speed and Recording Duration
Chart speed describes how quickly the recording medium moves, commonly expressed in millimeters per hour (mm/h) for paper chart recorders. It affects how measurement changes appear across the chart and how much time can be recorded on a given amount of paper.
A slower chart speed can accommodate longer recording periods, while a faster speed provides more chart space for examining short-term fluctuations. The appropriate setting depends on the rate at which the measured variable changes and the level of detail needed for analysis.
When comparing models, check the available chart speeds, adjustment options, and paper capacity. These factors help determine how frequently the chart needs to be replaced and whether the recorded trends will be easy to interpret.
Display and Alarm Functions
A digital display can help operators read current values and review instrument status. Alarm functions can provide an indication when a measured variable exceeds a configured threshold, provided the selected model supports the required alarm outputs.
Consider whether local readings, visual alarms, audible alerts, or external alarm connections are necessary. Check the number of alarm points, configuration options, and output specifications instead of assuming these features are included with every recorder.
Communication and Data Management
Some chart recorders offer communication interfaces for connecting with other equipment or monitoring systems. Depending on the model, these may support data transmission, remote monitoring, or integration with a larger measurement setup.
Before selecting a recorder for system integration, confirm the available interfaces, communication protocols, and supported functions. If electronic data storage or file export is essential, verify those capabilities explicitly.
Installation and Power Requirements
The installation environment can influence instrument reliability and suitability. Review the required power supply, mounting dimensions, operating temperature range, humidity limits, and enclosure protection rating.
For installations exposed to dust, moisture, vibration, or electrical interference, confirm that the recorder meets the relevant environmental requirements. Proper installation and compatible wiring also help maintain reliable measurements.
Chart Recorder Selection Comparison Table
The following table summarizes the main specifications to compare when evaluating different chart recorder models.
| Selection Factor | What to Check | Why It Matters |
|---|---|---|
| Recording method | Pen, thermal printing, or electronic recording | Determines how measurement records are created and reviewed |
| Input channels | Number of channels and supported configurations | Determines how many measurement signals can be monitored |
| Signal compatibility | Thermocouple, RTD, voltage, current, or other specified inputs | Ensures compatibility with sensors and transmitters |
| Measurement accuracy | Accuracy specification and measurement range | Helps determine suitability for the required measurement quality |
| Chart speed | Available recording speeds in mm/h | Affects trend detail and recording duration |
| Alarm functions | Alarm points, outputs, and configuration | Supports monitoring of specified measurement limits |
| Communication | Available interfaces and protocols | Determines compatibility with external monitoring systems |
| Installation | Power supply, dimensions, and environmental limits | Helps ensure the recorder fits the intended location |
Conclusion
Selecting the right recorder starts with understanding your measurement requirements, input signals, and recording methods. By comparing these factors, you can find a suitable solution for temperature monitoring, process measurement, and long-term data recording. Explore SISCO's range of chart recording instruments to compare available models and identify an option that meets your application needs.
Whether you need a paper chart recorder for physical records or are comparing alternative recording technologies, begin with your measurement requirements and verify the specifications of each model.