
A chart recorder is a measuring instrument that records changes in physical parameters over time, such as temperature, pressure, humidity, and other process variables. By creating a continuous or time-based record of measured values, chart recorders help users monitor operating conditions, identify measurement trends, and review historical data.
Chart recorders are used in laboratories, manufacturing facilities, environmental monitoring, and other applications that require measurement records over time. Understanding how a chart recorder works, its main types, and its practical applications can help users select an appropriate recording instrument for their measurement needs.
What Is a Chart Recorder?
A chart recorder is an instrument that measures a signal and records its variations on chart paper. Depending on the model, it may use a pen mechanism or a thermal recording method to mark measured values on a moving paper chart.
As measurements change, the recorded trace shows how a variable behaves over a specific period. Users can examine the chart to identify fluctuations, compare measurement trends, and review operating conditions. For applications requiring electronic measurement data collection, data acquisition and logging systems can provide additional options for collecting, storing, and managing measurement data.
Common measurement variables include:
- Temperature: Tracks temperature changes in equipment, storage areas, and test environments.
- Pressure: Records pressure variations in pipelines, process systems, and test setups.
- Humidity: Monitors changes in relative humidity in controlled environments.
- Electrical signals: Records supported voltage, current, or other input signals, depending on the instrument's specifications.
- Other process variables: Monitors compatible sensor signals in laboratory and production applications.
For users who need physical records of measurement trends, chart recorders provide a practical way to document changes over time.
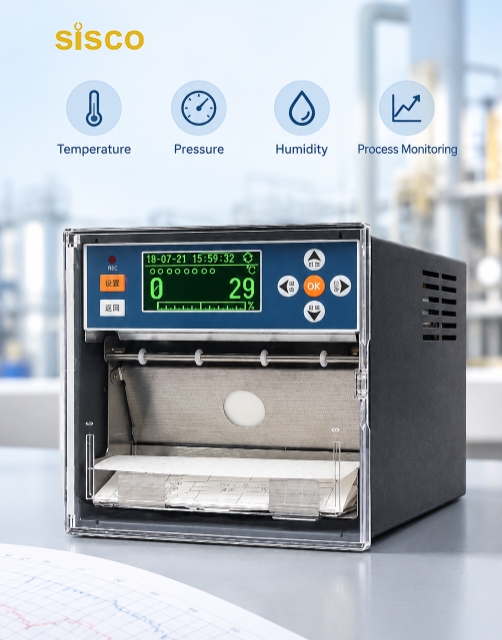
How Does a Chart Recorder Work?
A chart recorder converts an input signal into a visible record of measurement changes. Although the exact design varies by model, the basic operating process generally involves four steps.
1. Signal Input
The chart recorder receives a measurement signal from a built-in measuring element, an external sensor, or another compatible source. Supported inputs may include thermocouples, resistance temperature detectors (RTDs), voltage signals, and current signals, depending on the model.
2. Signal Processing
The instrument processes the input signal and converts it into a measurement value. Signal conditioning and calibration help the recorder display or record values within its specified measurement range and accuracy.
3. Chart Movement and Recording
The chart paper recorders moves at a selected speed while the recording mechanism marks the measured value. A pen recorder typically uses a pen to draw a trace, while a thermal recorder uses a compatible thermal recording method. The resulting chart shows measurement changes in relation to time.
4. Reviewing Recorded Data
After recording, users can examine the chart to identify trends, fluctuations, and unusual measurement changes. The paper record can also be retained for documentation and later reference.
The chart speed, recording mechanism, input configuration, and available functions vary by model, so users should check the specifications before selecting a recorder.
Types of Chart Recorders
Chart recorders are available in different configurations to meet various measurement and recording requirements. The main differences include chart format, recording mechanism, input channels, and display functions.
1. Strip Chart Recorders
A strip chart recorder records measurement values on a continuous strip of paper. The paper advances over time, producing a trace that shows how the measured variable changes.
Strip chart recorders are useful for applications that require continuous trend monitoring and a chronological record of measurement data. Depending on the model, they may support one or multiple input channels.
2. Circular Chart Recorders
A circular chart recorder records measurements on a circular paper chart. The chart rotates during operation, and the recording mechanism marks measurement changes over time.
Circular chart recorders are often used when a circular recording format suits the monitoring process. Users should consider chart duration, recording range, measurement accuracy, and the number of recording channels when comparing models.
3. Chart Recorders with Digital Displays
Some chart recorders combine paper-based recording with a digital display. The screen presents measurement values for convenient reading, while the recording mechanism maintains a physical chart of measurement trends.
The available display functions, input channels, alarms, and communication interfaces depend on the specific model. A digital display does not necessarily mean that the instrument supports electronic data storage or network communication, so these functions should be verified in the product specifications.
Common Applications of Chart Recorders
Chart recorders support applications where observing measurement changes over time and maintaining a physical record are important.
Temperature Monitoring
Temperature chart recorders track temperature variations in laboratories, testing environments, manufacturing processes, and other temperature-sensitive applications. The recorded chart helps users review temperature trends and identify changes that may require further investigation.
Pressure Measurement
In pressure monitoring applications, compatible chart recorders record pressure variations over time. These records can help users examine changes in operating conditions and review pressure behavior during testing or routine monitoring.
Laboratory Testing
Laboratories may use chart recorders to document measurement trends during experiments, material testing, and environmental tests. A physical recording provides a visual reference for reviewing results and comparing changes during a test period.
Manufacturing and Process Monitoring
Manufacturing processes may require continuous monitoring of variables such as temperature and pressure. Chart recorders can provide a time-based record that supports process observation, troubleshooting, and operational documentation.
Environmental Monitoring
Depending on the supported inputs and measurement configuration, chart recorders can record environmental variables such as temperature and humidity. These records can help users review environmental changes in storage areas, laboratories, and controlled spaces.
Chart Recorder vs. Paperless Recorder
Chart recorders and paperless data recorders both capture measurement data over time, but they differ in how the information is recorded and stored.
| Feature | Chart Recorder | Paperless Recorder |
|---|---|---|
| Recording method | Records measurements on chart paper | Stores measurement data electronically |
| Data presentation | Physical trace on a paper chart | Digital values, trends, or electronic records |
| Record retention | Requires retaining the paper chart | Depends on internal memory or supported storage |
| Data review | Users inspect the recorded paper chart | Users review data through supported digital functions |
| Typical consideration | Paper supply and chart replacement | Storage capacity, data export, and available interfaces |
The appropriate choice depends on how measurement data needs to be recorded, reviewed, and retained. A paper chart recorder may suit applications that require a physical record, while a paperless recorder may be more appropriate when electronic data storage and retrieval are priorities.
Explore Chart Recorders for Your Measurement Needs
Choosing the right chart recorder starts with understanding the variables to be measured, the required input signals, and how measurement records need to be maintained. Chart format, recording speed, channel configuration, and measurement accuracy are also important factors when comparing available models.
Whether you need to track temperature changes, record pressure variations, or maintain a physical record of test results, checking the specifications of each model can help you identify a suitable chart recording solution.
Understanding how chart recorders work helps users make informed decisions about measurement and data recording. For more measurement solutions, explore SISCO's testing and measurement instruments to find equipment for laboratory testing, process monitoring, and other measurement applications.